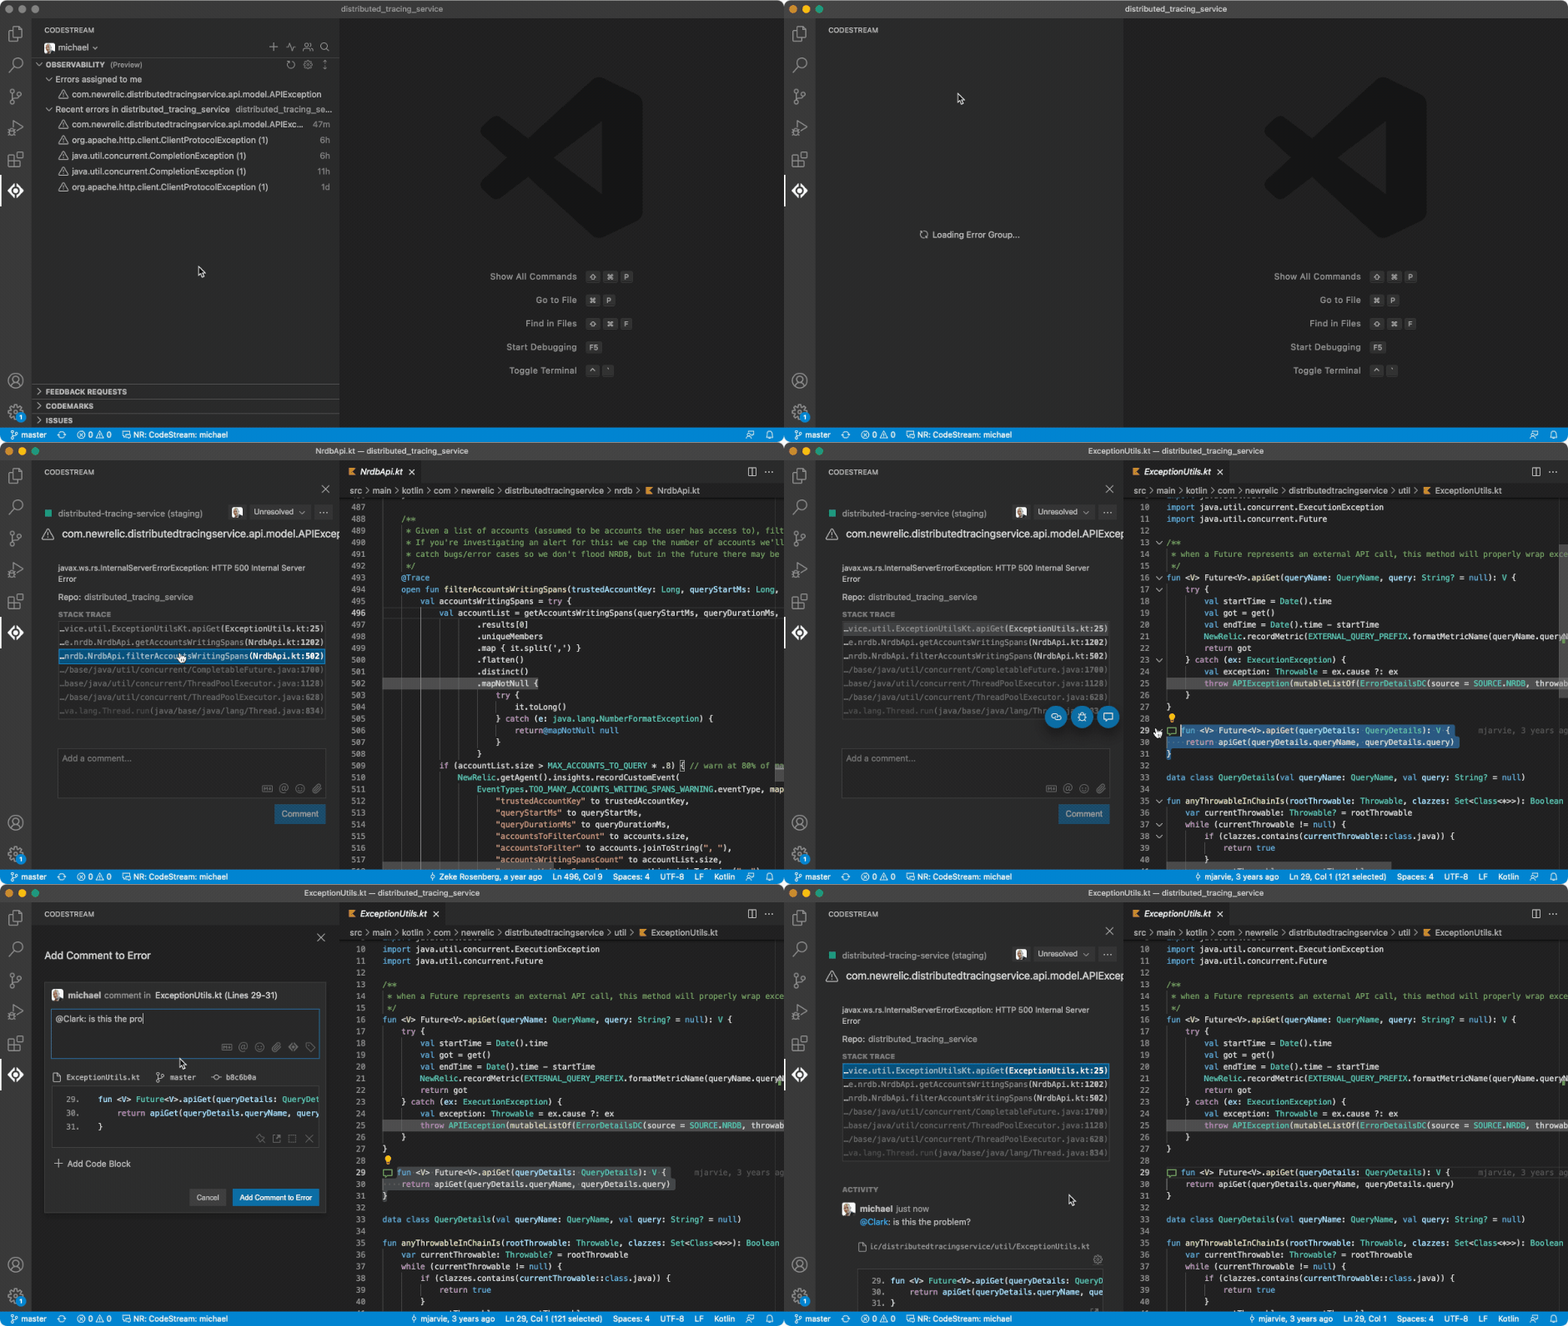
It’s important to know how your code is performing in production and whether or not it’s generating errors. To help you with this, New Relic CodeStream brings performance monitoring right into your IDE.
Connect CodeStream to your New Relic One account
Once you’ve connected CodeStream to your New Relic One account, and you've created one or more workloads with errors inbox on New Relic One, use Open in IDE to see APM errors with stack traces directly in your IDE.
When you've connected New Relic CodeStream to your New Relic One account, in errors inbox click Open in IDE to see the code that caused the error.
Once connected, all of your collaboration work in CodeStream (such as the discussion, assignee, and error status) syncs with New Relic One, where you can continue to collaborate. A typical collaboration session could include developers commenting on code in their IDEs, a DevOps engineer assigning errors in errors inbox, and a development manager following along in Slack. By meeting people in the tools they're already using, New Relic CodeStream shortens the amount of time between error discovery and error resolution.
CodeStream observability
In addition to errors inbox, discover errors in your IDE in the CodeStream observability section. In addition to recent errors in your repos, see any specific errors assigned to you.
Use CodeStream's observability section to keep up to date with recent and assigned stack trace errors.
Error details
No matter how you've arrived at an error in your IDE, CodeStream presents all of the error’s details, including the stack trace, and you can collaborate with your teammates to resolve the error.

Click any frame in the stack trace to jump straight to the corresponding file and line number in your IDE. As you navigate the stack trace, if you come across code that seems like the source of your problem, select it and click the comment icon to start collaborating.
Collaborate with CodeStream
CodeStream automatically mentions the most recent person to touch the code related to the error, making it easy for you to bring the right people into the discussion.
Once you’ve identified the problem you can assign the error, either to an existing teammate on CodeStream or to a person suggested based on the repository’s Git commit history.
You can update the error’s status from unresolved to resolved or ignored.
Use build SHAs with CodeStream
The build SHA not configured warning message reads: No build SHA associated with this error. Your version of the code may not match the environment that triggered the error.
You may see this warning if there's no build SHA associated with a specific error.
CodeStream uses the build SHA to match the specific stack trace error with the version of the code running in the environment that triggered the error.
To resolve this warning, set the environment variables for your APM agent.
Even without the build SHA configured, you can still investigate the error, but you may not be looking at the version of the code that caused it.
The build SHA not found warning message reads: Your version of the code doesn't match production. Fetch the following commit to better investigate the error.
If you do have build SHAs configured, but the version of the code you're on locally doesn't contain that commit, CodeStream will let you know so that you can more effectively investigate and resolve the error.
CodeStream will also let you know if the error doesn’t have a stack trace associated with it. This happens with older errors when the stack trace has aged out on New Relic One.
Other collaboration tools
In an error discussion, use the ... More actions dropdown to share the continue the collaboration on other tools, like Slack or Microsoft Teams.
Associate your repo
If there's no repository associated with CodeStream when you click Open in IDE on an error, CodeStream prompts you to do so.
All of the repos you currently have open in your IDE are listed in the select a repo dropdown.
If you don’t see the repository you want listed, open it in your IDE and it will automatically get added to the list. If you’re working with a fork, make sure you select the upstream remote.
To avoid having to do this manual association every time you open an error, you can make these associations via your APM agent's environment variables.
For more help
If you need more help, check out these support and learning resources:
- Browse the Explorers Hub to get help from the community and join in discussions.
- Find answers on our sites and learn how to use our support portal.
- Run New Relic Diagnostics, our troubleshooting tool for Linux, Windows, and macOS.
- Review New Relic's and and documentation.


