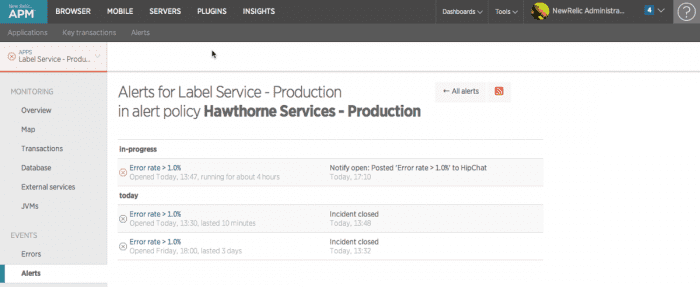
APM's Alerts page shows a table of alerts over the past two weeks that you can drill down into detailed information, including throughput, error rate percentage, and history. You can view alert history for a specific application or for all applications.
ヒント
Access to this feature depends on your subscription level.
Alerts for specific apps
To view a list of alerts for a specific app: Go to one.newrelic.com > Explorer > (select an app) > Events > Alerts.
one.newrelic.com > APM > (select an app) > Events > Alerts: Use this page to view or filter information about alerts over the past two weeks.
The Alerts page shows a list of alerts over the past two weeks, if any. Use any of New Relic's standard user interface functions and page functions to drill down into detailed information.
Each alert notification includes the alert icon and summary information. To view details about an alert notification on the Alerts page, select its link. For example:
- To view details about a specific alert, select its name.
- To narrow the list of alerts, use the Filter.
- To view all alerts for all of your apps and hosts, select the All alerts link.
- To select a specific Java Virtual Machine (JVM) if applicable, select your choice from the JVMs menu.
Alerts across apps and hosts
To view history about Critical alerts and outages across all of your applications and hosts:
- Go to rpm.newrelic.com/apm > Alerts > Alert history.
- Optional: Select Show alerts for hidden applications.
The list separates alerts into categories, including:
- In progress
- Today
- Yesterday
- This week
- Prior to last week
From here you can filter and select select specific incidents.
その他のヘルプ
さらに支援が必要な場合は、これらのサポートと学習リソースを確認してください:
- Explorers Hubでは、コミュニティからのサポートを受けたり、ディスカッションに参加したりすることができます。
- 当社サイトで答えを見つけて、サポートポータルの使用方法を確認してください。
- Linux、Windows、およびmacOS向けトラブルシューティングツールであるNew Relic Diagnosticsを実行してください。
- New Relicの とandドキュメント をご確認ください。
