New Relic's Java agent 3.9.0 or higher supports both the Java Message Service (JMS) 1.1 API and the RabbitMQ Java client library. This gives you insights into the performance of your message processing, for both incoming and outgoing messages.
The APM UI will show transactions initiated via JMS 1.1 or RabbitMQ message receipt as Message background tasks. Message creation via JMS or RabbitMQ also appears in transaction traces.
Performance improvements with background tasks
One way to increase responsiveness of web applications is to delegate work to background processes. Message queues are commonly used for this inter-process communication.
In the context of message queuing systems, applications typically interact with message brokers to send and receive messages. The RabbitMQ Java client library allows Java applications to interface with message brokers that implement the Advanced Message Queueing Protocol (AMQP) 0.9.
New Relic's Java agent shows messages sent and received using the RabbitMQ client library and JMS. With this visibility, you can see details including:
- Number of messages handled by your app
- Time your app spends publishing messages
- Time your app spends processing "dequeued" messages
APM's conveniently group and report operations that interact with temporary queues. By analyzing this information, you can more easily identify areas where processes take too much time and may be handled better as background messages.
Installation requirements
To monitor your RabbitMQ client activity, make sure you have downloaded and installed New Relic's Java agent version 3.9.0 or higher.
To monitor JMS, make sure you have downloaded and installed New Relic's Java agent version 3.3.1 or higher.
ヒント
For additional monitoring of your RabbitMQ systems, use the free RabbitMQ plugin for New Relic. This plugin is published and supported by Pivotal, the corporate parents of RabbitMQ.
Queue operations
Supported entry points for queue operations appear as Put (publish a message) or Take (receive a message) in APM's user interface.
Queue operations | Publish a message ( | Receive a message ( |
|---|---|---|
RabbitMQ |
|
|
JMS |
|
|
View message queue operations
Queue operations appear in APM's Transactions page for the selected app. The Put and Take metrics appear in the Breakdown table and are categorized as MessageBroker metrics. Here is an example.
one.newrelic.com > APM > (selected app) > Monitor >Transactions > (selected transaction): The transaction’s Breakdown table categorizes queue operations as MessageBroker metrics and labels them as Put (publish a message) or Take (receive a message).
Transaction traces also may provide additional details.
ヒント
You can select transaction traces from the app's Summary or Transactions pages in APM.
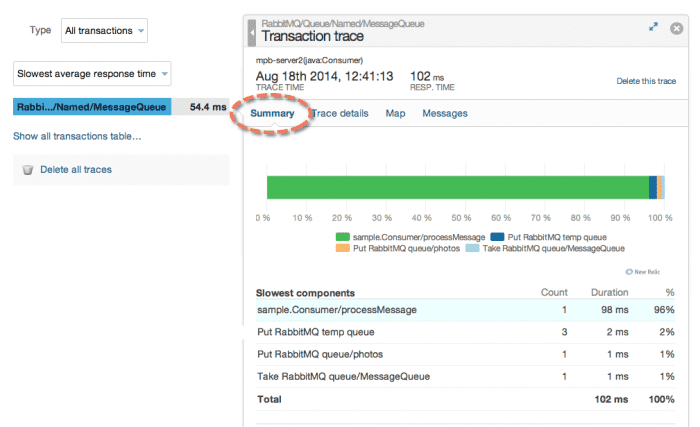
The Transaction trace summary page also may show Put and Take operations in the Slowest components section. For example:
one.newrelic.com > APM > (selected app) > Monitor > Summary > (selected transaction trace): In this example, the selected transaction trace's Summary shows RabbitMQ operations in the colored bar chart. The Slowest components section also lists the RabbitMQ Put and Take results.
The Transaction trace page also may include a dedicated Messages tab. Here is an example.
one.newrelic.com > APM > (selected app) > Monitor > Summary > (selected transaction trace): In this example, the selected transaction trace's Messages tab lists the RabbitMQ message details.
その他のヘルプ
さらに支援が必要な場合は、これらのサポートと学習リソースを確認してください:
- Explorers Hubでは、コミュニティからのサポートを受けたり、ディスカッションに参加したりすることができます。
- 当社サイトで答えを見つけて、サポートポータルの使用方法を確認してください。
- Linux、Windows、およびmacOS向けトラブルシューティングツールであるNew Relic Diagnosticsを実行してください。
- New Relicの とandドキュメント をご確認ください。


