New Relic One is the platform that gives you access to core platform capabilities like querying data and building charts, our more curated observability UI experiences features, and our alerting and Applied Intelligence tools. With New Relic One, you can see and act on all the data throughout your entire system.
To access New Relic One:
- Go to one.newrelic.com.
- Or, if you report data to the EU data center go to one.eu.newrelic.com.
Tip
Learn more about New Relic One’s basic UI features.
Quickly understand context
We provide multiple ways to understand your system's dependencies, so you can easily see how everything fits together and troubleshoot problems. New Relic One gives you and your teams a connected view that cuts through complexity!
If you want to... | Use this |
|---|---|
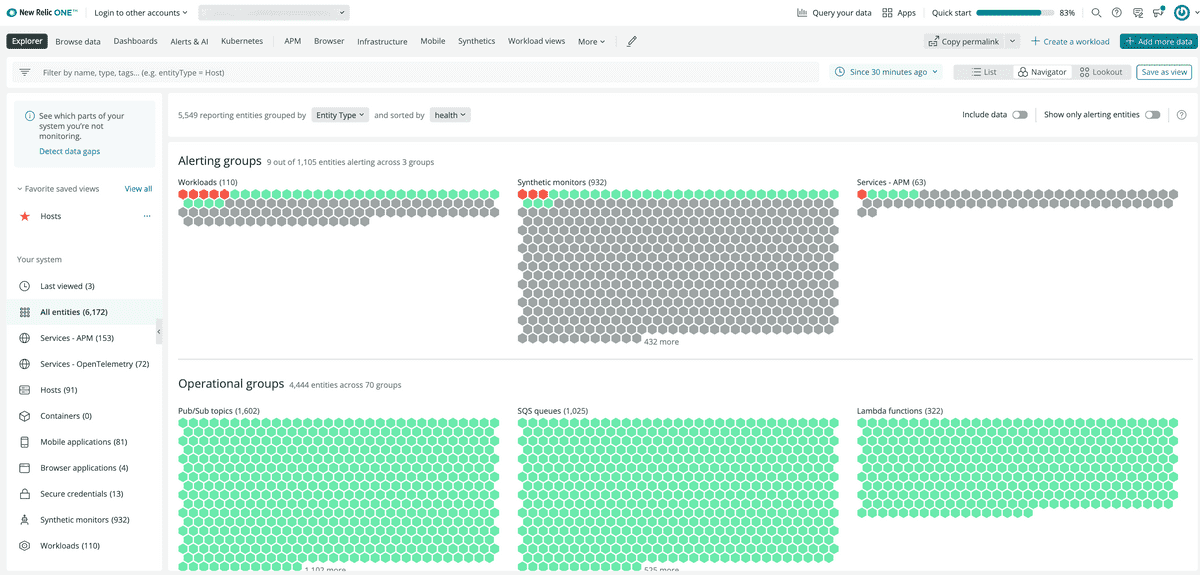
Have an overall view of your system, and drill down to get performance details. | Use the New Relic Explorer as the front door to New Relic One: observe, group, and filter the performance data from all the entities (that is, all applications, services, hosts, or containers) in your system. Gain extensive visibility into each entity in your solution, its alert status, and how the entities are connected. Use the New Relic Navigator to give you a high density overview of all your entities so you can detect any issues at a glance. And use the New Relic Lookout to spot entities recently experiencing behavior deviations. |
Provide context for your entities. | Add tags to all your entities. Or create tags for teams and all the services they monitor. Use tags to illustrate relationships and contextual information for what you monitor. By thoughtfully tagging your entities, you can connect all the data your teams need to understand their increasingly complex and interdependent systems. |
See how each part of your system is connected. | Service maps illustrate your upstream and downstream dependencies. |
Visualize the aggregated health and activity data from all you monitor. | Group and monitor any entities together into functional team-focused, project-focused groupings, or any other attribute, with workloads. |
Fetch and analyze specific data. | Get more context while you query with the query builder, which surfaces data definitions as you craft and edit queries. |
Create visuals that showcase your business needs at a glance. | Tailor custom dashboards for your unique needs. |
Find a service or dashboard in a complex environment. | Search by name across all accounts in the unified search, or filter the explorer by tags or text. View everything you’re monitoring in one place, like entities or dashboards across your organization. |
View a list of all the dependencies for a service. | The dependencies view tab in an entity summary shows all the dependencies of the entity you’re viewing. |
Track activity as it moves across your distributed system. | Distributed tracing helps you analyze your modern environment. |
Understand how everything is connected via API. | The NerdGraph GraphiQL explorer manages all your entities, tags, and relationships. |
Query your data more easily
On the Browse data menu on the top navigation menu you can easily access your basic telemetry data (metrics, events, logs, and traces).
Wherever you go in the UI, Query your data is available. No matter your level of proficiency with our query language, you can create custom queries and charts:
- Browse your data in a query-less experience with our data explorer.
- Use your NRQL (our query language) expertise to build custom charts in the query builder.
- Run PromQL-style queries in the query builder.
one.newrelic.com > Query your data: Build NRQL and PROMQL-like queries.
Enhanced dashboards
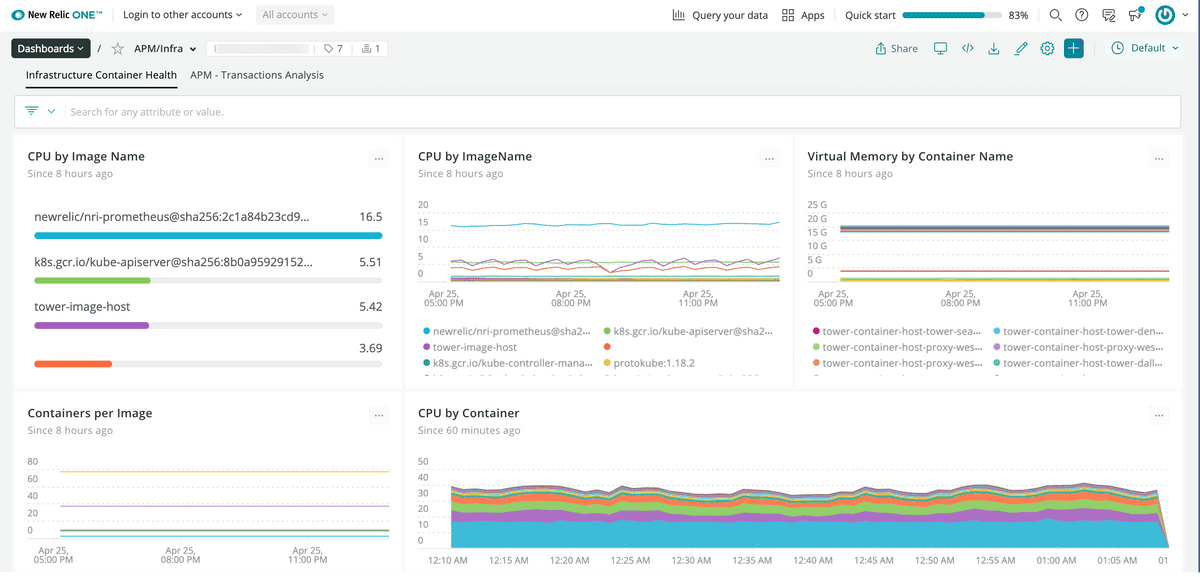
one.newrelic.com > Dashboards: Quickly create information dense custom views into the data that matters most to you with dashboards in New Relic One.
New Relic One dashboards let you build better visualizations more easily, with more options to customize. Dashboard features include:
- Perform NRQL queries and create charts and dashboards everywhere in the platform using the query builder.
- Manage your charts and dashboards easily using our quick-access CRUD menus and editing options.
- Explore and contextualize data with advanced tooltips and zoom in functions to monitor what your systems are doing in real time.
- Search your dashboards for attributes and metrics.
- Send data to your dashboards using our agents, integrations, and APIs.
- Share dashboards or charts as a .pdf, or embed a chart in an external site.
Tip
If you previously used New Relic Insights to create dashboards, these are available as New Relic One dashboards.
Build on New Relic One
If custom charts and dashboards don't solve your current challenge, we give you a framework for building React JavaScript applications that:
- Live on New Relic One, alongside your other New Relic-monitored data.
- Feature highly tailored visualizations.
- Display data from any source you want, whether from a New Relic-monitored entity or data from any service or API.
And you can use open source apps built by the community, and contribute your own open source apps.
To learn more, see New Relic One applications.
What’s next?
To get started understanding how to get around in New Relic One:
- See what data you have available with the data explorer.
- Browse your monitored entities with the New Relic Explorer.
- Use our NerdGraph API to add tags to your data.
- Learn about dashboards.
For more help
If you need more help, check out these support and learning resources:
- Browse the Explorers Hub to get help from the community and join in discussions.
- Find answers on our sites and learn how to use our support portal.
- Run New Relic Diagnostics, our troubleshooting tool for Linux, Windows, and macOS.
- Review New Relic's and and documentation.


