The user interface for New Relic's iPhone and iPad app provides functionality similar to New Relic's standard user interface, with customized details for mobile users.
The New Relic iOS apps show near real-time information about your apps, hosts, and more.
Features
 New Relic's iOS app includes these New Relic products and features:
New Relic's iOS app for iPhone and iPad includes these New Relic products and features:
- APM (iPhone and iPad). Includes real-time and historical data. Select the
 icon to see transaction details. Select Overview Charts to view summary charts of your top five transactions.
 - Browser monitoring (iPhone and iPad). Provide overview dashboard, including average page load time, browser Apdex, average throughput, and more.
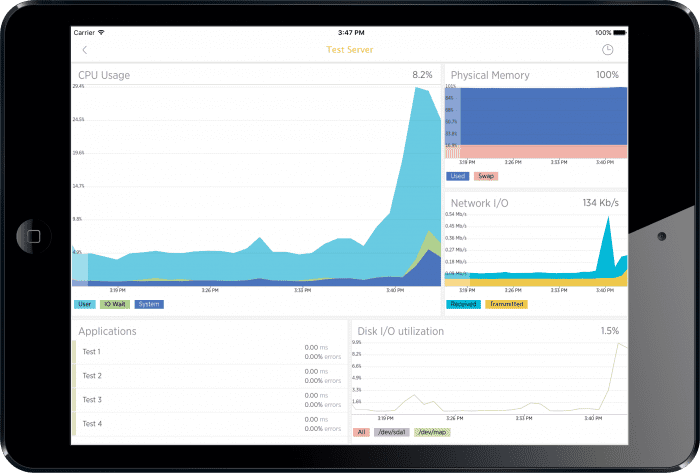
- Infrastructure monitoring (iPhone only).
- Alerts (iPhone and iPad). Get alert and deployment notifications.
- Synthetic monitoring (iPhone only).
- Mobile monitoring (iPhone and iPad). Includes crash reports, network errors, API calls, and active user count.
New Relic's iOS app does not have all the features of the New Relic web application. For more detailed analysis, sign in to your New Relic account with a web browser.
Time range
When viewing an application or host, you can change the visible time frame by using the clock icon in the top right of the page. This feature is similar to the standard New Relic time picker. Features include:
- Scrub the New Relic charts to move back and forth across the timeline.
- Select the time picker to choose a time range that ends now (from 30 minutes to 90 days ago).
- For iPads: to specify an end time other than now, slide the toggle from Ending Now to Custom Date.
Synthetic monitoring
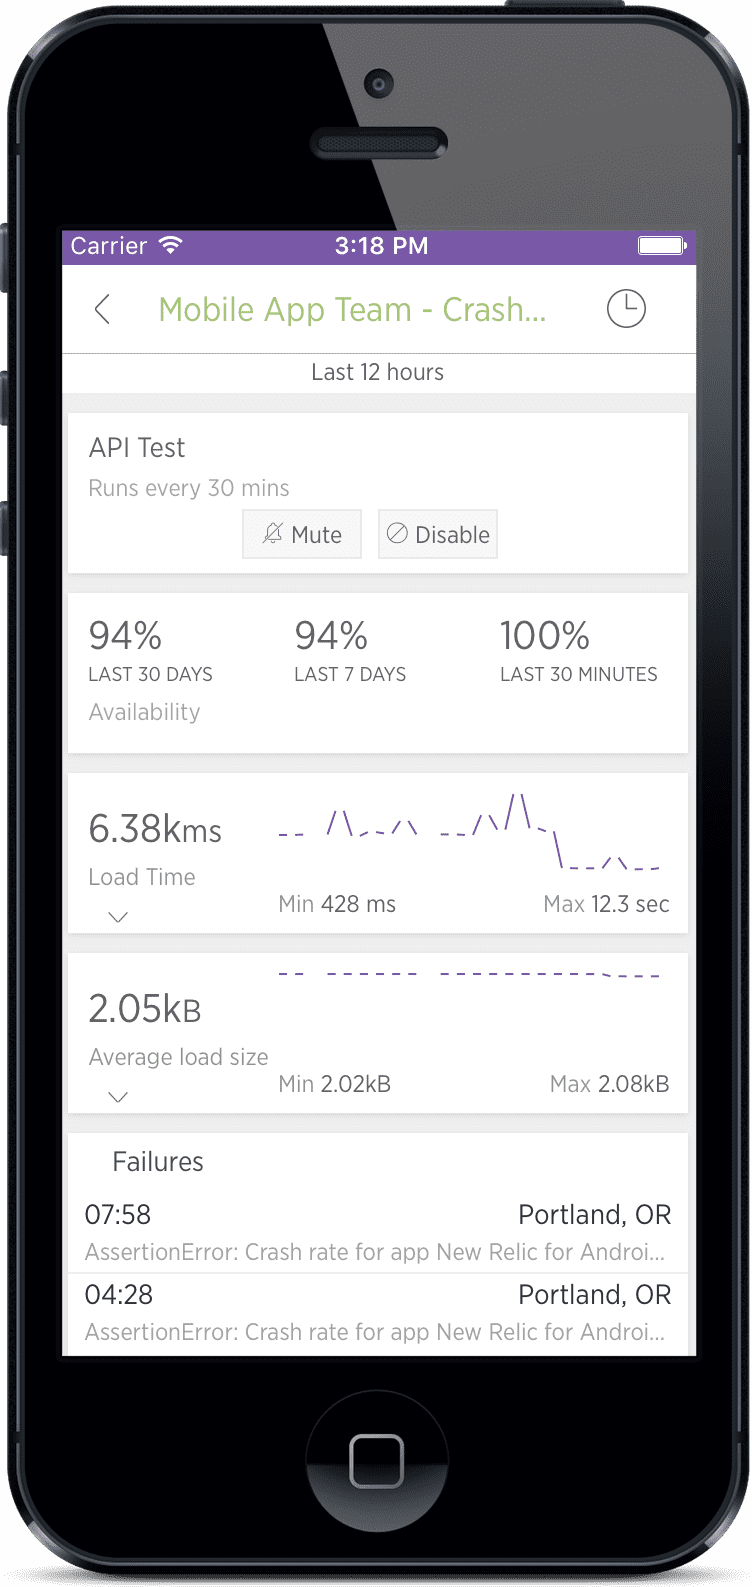
 You can use the iOS app to view your synthetic monitoring data, including charts of your monitor's availability, load times, and load sizes. Select the caret
icon to view more detailed charts. You can mute or disable your monitor, and view details of any recent errors. For scripted monitors, you can view and search the script log.
Alerts
When you connect the iOS app to your New Relic account, your device is automatically associated with your user channel. Then, you can add your user channel to your target policy to receive alerts. For iOS alerts, notifications appear on your lock screen and can be viewed by swiping the alert.
You can select any alert to view error details or acknowledge the alert. New Relic also sends a push notification when a colleague acknowledges an open event. Then, New Relic sends a final, closing notification when all Critical events end.
Mobile monitoring
If you have a mobile application and have installed mobile monitoring, you can monitor its performance directly from your iPhone or iPad. Mobile monitoring includes network errors, API calls, and number of active users. You can also view detailed individual crash reports for a deeper understanding of a particular crash incident.
Data privacy
New Relic's mobile apps only record information needed to help authenticate and troubleshoot:
- User's email address associated with your New Relic account, including first and last name (for authentication purposes only)
- IP address
- Device ID
For more information, see our Mobile data privacy and security documentation.
For more help
If you need more help, check out these support and learning resources:
- Browse the Explorers Hub to get help from the community and join in discussions.
- Find answers on our sites and learn how to use our support portal.
- Run New Relic Diagnostics, our troubleshooting tool for Linux, Windows, and macOS.
- Review New Relic's and and documentation.
