New Relic provides flexible, dynamic observability of your entire infrastructure, from services running in the cloud or on dedicated hosts to containers running in orchestrated environments. You can connect the health and performance of all your hosts to application context, logs, and configuration changes.
With infrastructure monitoring, modern operations teams get complete observability of complex and hybrid systems, from a datacenter to thousands of Amazon, Google Cloud, or Azure instances.
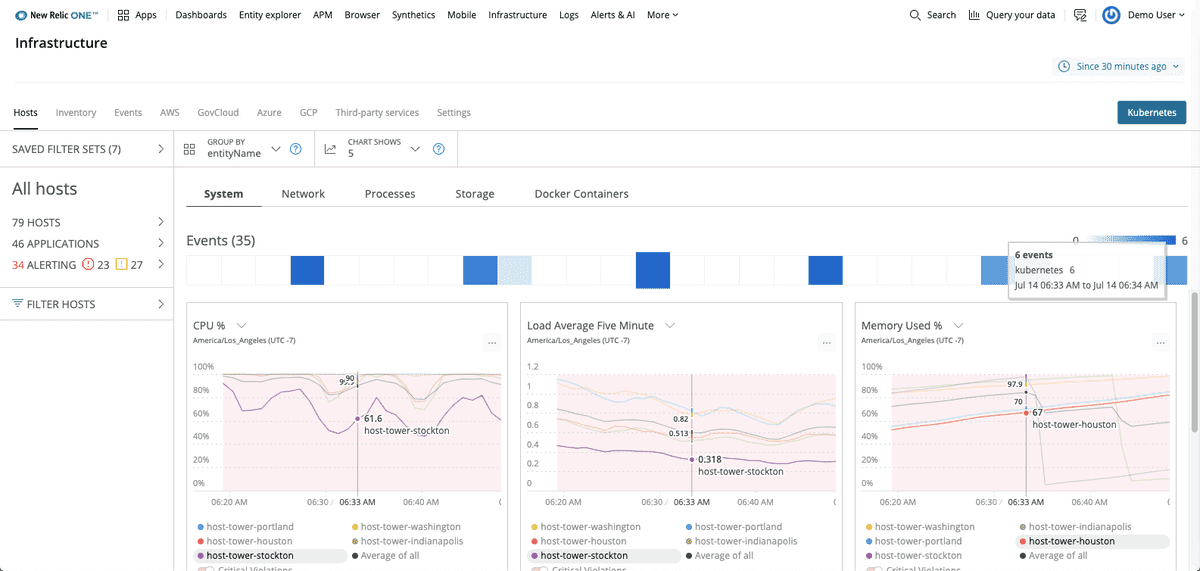
The Hosts page for your infrastructure in New Relic One shows performance indicators for systems, networks, processes, and storage.
Quick start: Use our guided install
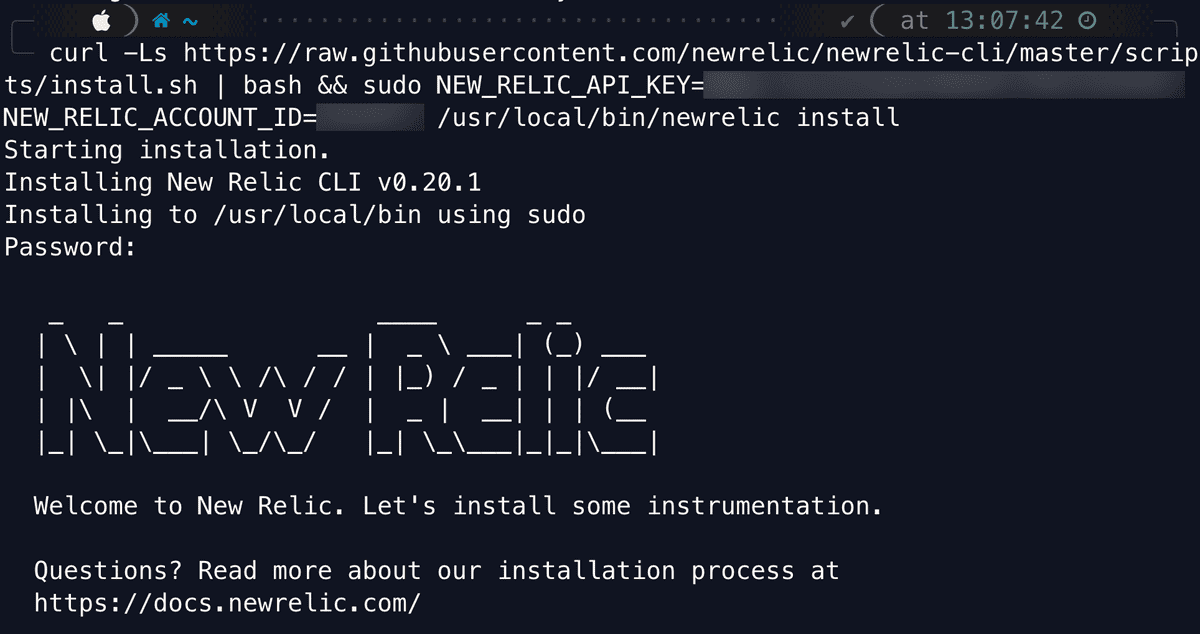
The quickest way to get started with our infrastructure monitoring agent is through our guided install.
Our guided install not only installs the infrastructure agent, but also discovers the applications and log sources running in your environment. It recommends which ones you should instrument.
The guided install works with most setups. But if it doesn't suit your needs, you can find other methods below to get started monitoring your infrastructure.
Reduce MTTR with actionable data
Real-time metrics and analytics reduce your mean-time-to-resolution (MTTR) by connecting changes in host performance to changes in your configuration. From the Inventory page you can search across your entire estate to find exactly which of your hosts contain particular packages, configs, or startup scripts.
The Inventory page in New Relic One focuses on all the infrastructure entities in your estate.
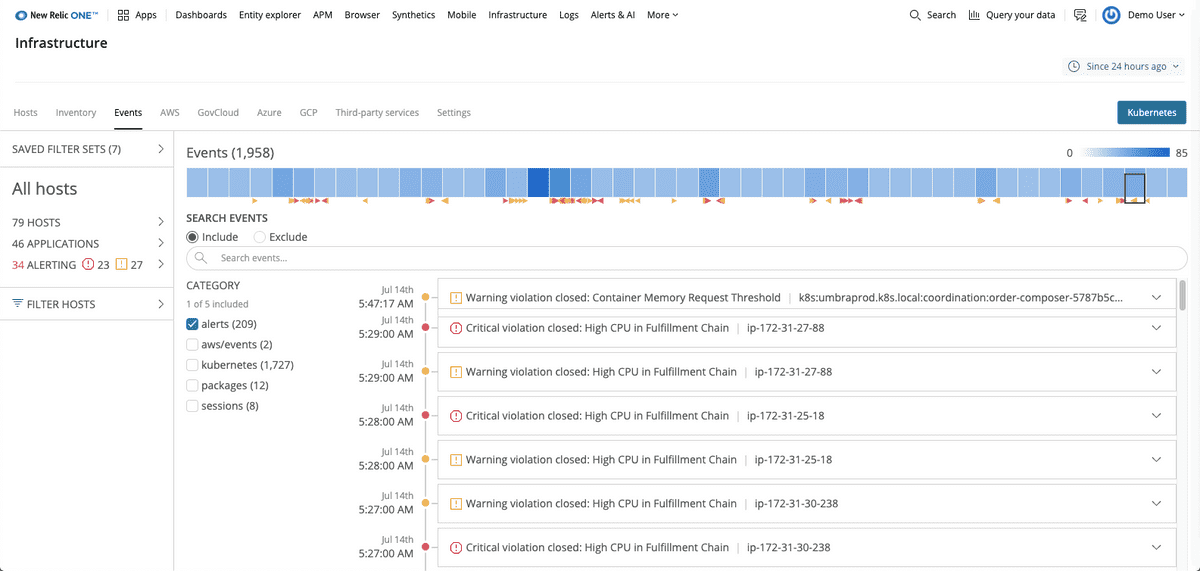
From the Events page you can track config changes, restarts, SSH sessions, and other key event changes. A real-time feed gives you a changelog for your entire infrastructure. Our solution securely collects and displays your data in five seconds, so your monitoring never lags behind reality.
The Events page in New Relic One contains a real-time feed of all that is happening in your hosts.
With our infrastructure monitoring tools you can also:
- Query your data to drill down into your infrastructure events and build custom dashboards that you can share with your team.
- Troubleshoot performance issues, no matter where the issue occurs—server-side or application-side—thanks to APM data connection with infrastructure monitoring.
- Create, view, or update alert settings directly from the relevant infrastructure chart. For example, you can create a host not reporting alert condition.
- Forward logs to our logs monitoring by adding as many configuration files as log sources you need to push to our platform.
Install and configure the infrastructure agent
You can send metric data to our platform using our open source infrastructure agent, a lightweight executable file that works in the background to collect the information you need.
The simplest way to install and run the infrastructure agent is using a package manager (Linux) or the MSI installer (Windows). You can also use our installation assistants:
To use the links above, you must be logged to your New Relic account.
If you don't have a New Relic account yet, or prefer to follow the procedure step-by-step, see our tutorials to install the agent for Linux | Windows | Elastic Beanstalk | Ansible | Chef | Puppet.
Add integrations to gather data about your services
Integrations give you access to the metrics of many popular systems, including Amazon Web Services (AWS), Google Cloud Platform, Microsoft Azure, Kubernetes, MySQL, Cassandra, and more.
You can also make your own integrations using New Relic Flex or the Integrations SDK to collect data from other applications. With New Relic Flex, you can instrument any command-line tool without coding.
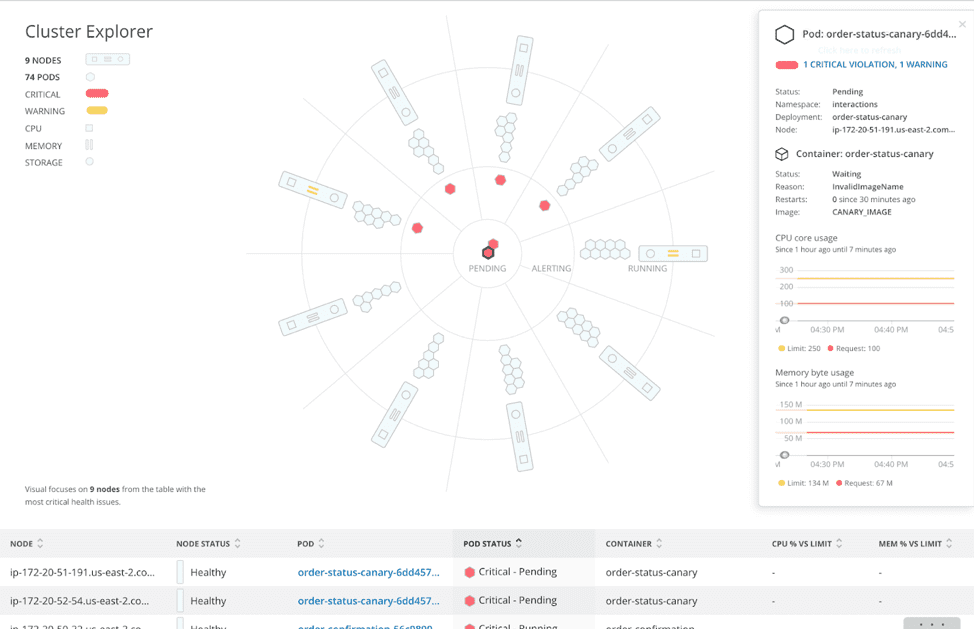
Our Kubernetes cluster explorer in New Relic One gives you a powerful and innovative solution to the challenges associated with running Kubernetes at a large scale.
Filter your hosts any way you want
Filter sets allow you to organize your hosts based on criteria that matter most to you. You can filter your hosts by any infrastructure attribute, such as geographic location, hostname, or Linux distribution.
You can also filter on Amazon attributes, such as region or instance type, and add custom attributes to define unique metadata, such as what team manages the host or the services running.
Explore your infrastructure data
You can query and visualize your infrastructure data in New Relic One:
- Sample and search infrastructure events, such as to gain full understanding of the data being collected.
- Browse your data visually with the data explorer.
- Create custom SQL-like queries of your data using the New Relic Query Language (NRQL), or query your data using our PromQL-style queries.
- Use dashboards to build advanced data visualizations, contextualize data, and understand what's going on in your system, real-time.
Check the source code
The infrastructure agent is open source software. That means you can browse its source code and send improvements, or create your own fork and build it. For more information, see the README.
For more help
If you need more help, check out these support and learning resources:
- Browse the Explorers Hub to get help from the community and join in discussions.
- Find answers on our sites and learn how to use our support portal.
- Run New Relic Diagnostics, our troubleshooting tool for Linux, Windows, and macOS.
- Review New Relic's and and documentation.


