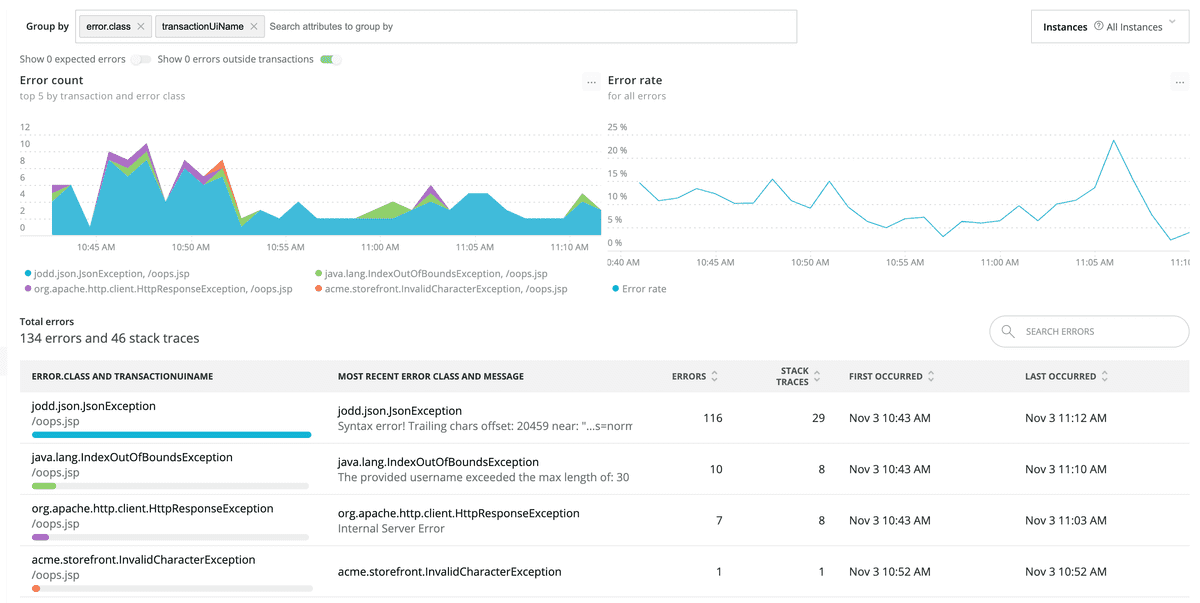
With the Errors UI in New Relic One, you can see the line of code that's causing a bad experience for your users, and get enough data to reproduce the issue so you can fix it. When you do, you’ll be able to confirm your fix is working in production.
Use Errors in New Relic One to:
- Group and filter events to triage important errors.
- Get alert notifications about errors.
- Review stack traces, logs, and other details.
- Share the error information with charts and dashboards.
- Report new errors using instrumentation, prevent certain errors from being reported, and filter out noisy errors using expected errors.
View the APM Errors page
Important
As of October 1, 2021, the APM Errors (classic) UI will be discontinued in favor of the New Relic One APM Errors UI. For more details, see our Explorers Hub post.
To view the Errors page:
Go to one.newrelic.com > APM > (select an app), then click the Error rate table's title on your selected app's Summary page.
OR
Go to one.newrelic.com > APM > (select an app) > Events > Errors.
APM Errors UI: The Error rate chart always shows the rate for all errors, even if a filter is applied. To drill down further, use grouping and filter options for the Top 5 by count chart and Error traces table. Use the Instance dropdown to focus on a specific instance.
Use the Errors workflow to identify problems
Use this basic workflow to get the most out of the information you see from the Errors page.
- Start with the Error rate chart to see at a glance whether there are any unexpected spikes, dips, or patterns with errors in general.
- Correlate any general patterns on the Top 5 errors chart to alerts occurring during the same time period. Use the groups and filters to examine the error events and attributes in more detail, and look for patterns with error messages, transaction names, or other groupings.
- Explore and share Error trace table information, including specific stack trace details, logs, and attributes (host, URL, user, custom attributes, etc.)
- Also review the Error profiles page to guide your investigation into which attribute values might be correlated to the cause of errors, by comparing the frequency of those values between transactions where the error did and didn't occur (only in the old UI).
Expected errors
Reduce noisy errors by marking them as “expected errors”. Such errors won't affect reported error rate or Apdex metrics. See Manage errors for more details.
Expected errors aren't shown by default on the Errors page. You can show them by turning on the Show N expected errors switch below the Group by bar.
Errors outside transactions
Using the New Relic agent API, you can record custom errors at any point in the execution of your code. Sometimes, such custom errors will occur when a transaction is not executing, such as in high-volume aynchronous code that doesn't handle an HTTP transaction.
Errors outside transactions are shown by default on the Errors page, but you can hide them by turning off the Show N errors outside transactions switch below the Group by bar.
Select the time period for error data
Use the time picker to examine details of error events over the past week. The error events view is available for up to a seven-day window of data collected over the last eight days.
You may notice slight differences in count if your time window is set to ending now. This occurs because the counts for the list and table may be requested at slightly different times as the page auto-refreshes.
For more help
If you need more help, check out these support and learning resources:
- Browse the Explorers Hub to get help from the community and join in discussions.
- Find answers on our sites and learn how to use our support portal.
- Run New Relic Diagnostics, our troubleshooting tool for Linux, Windows, and macOS.
- Review New Relic's and and documentation.
